|
"A Mechanistic Model for Biological Effects of Magnetic Fields"
Janie Page Blanchard and Carl F. Blackman
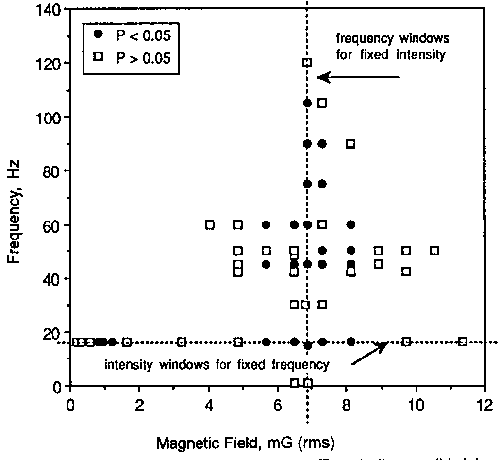
Figure 1: Combinations for frequency and strength of magnetic fields that influence calcium ion efflux from brain tissue in vitro.

Map of experiments performed in calcium efflux studies: solid dots represent experiments for which the exposed sample demonstrated a statistically significant difference from matched unexposed sample. Dotted horizontal and vertical lines indicate windows of effects with changes in magnetic field intensity and frequency, respectively. For example, along the horizontal cut line, there was no statistically significant change between the exposed and sham samples until around 1 mG (rms) exposure, which disappeared at higher intensities until around 5.7 mG (rms), persisting until 8 mG (rms) after which it disappeared again.
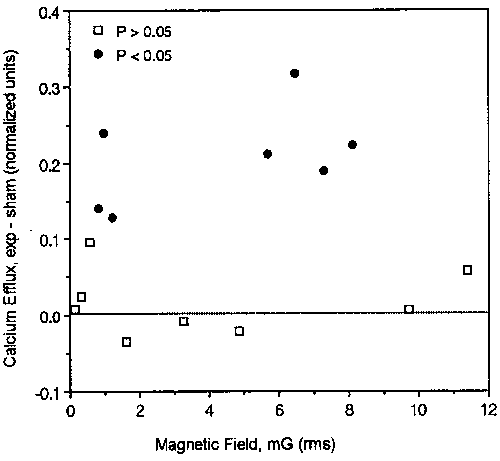
Figure 2: Detail of calcium ion efflux at 16 Hz

Details of the horizontal cut line of Figure 1, for a fixed magnetic field frequency of 16 Hz. (Note that the data point at the intersection of cut lines in Figure 1 was for 15 Hz, so it does not appear on this figure.)
| 


